Garbage numbers
A few days ago, while reading an article about the rise of made-for-TikTok brands, I came across a statistic I’d seen a couple times before, but had never really paused to interrogate: Gen Z, according to McKinsey, accounts for 40% of consumer spending. Anyone who’s spent any time in marketing, finance, or just on the internet has probably seen this statistic, and myriad ones like it: Gen Z is the most sustainability-minded generation, Gen Z has an eight-second attention span etc.
There should be a word for these particular nodes of information: they aren’t necessarily facts -- but they don’t seem nefarious enough to qualify as lies either. You accept them as truth because they have a unique capacity to stand distinct from the rest of the information that they introduce; they sit at the top of articles, justifying the existence of the content below (why else would we care about Gen Z brands, unless the kids really did have hundreds of billions of dollars in purchasing power?). They’re like the Muzak of facts, omnipresent, inoffensive, background noise.
Except maybe they are a bit nefarious. After all, entire industries are built on their facade. Take the notion that millennials favor an “experience economy” over “things” as an example: it launched millions of dollars into interactive art, high-touch retail, the Museum of Ice Cream, etc. While COVID probably makes it harder to determine whether or not the experience economy was or ever would have been a “success” (success, I’ll define here in a rather narrow capitalistic frame of -- “did it offer investors a return?”) -- I’d argue the bigger question is whether people even wanted an “experience” to begin with (and again, “experience” is also pretty narrowly defined as “however the retailers, curators, venue-owners, and conference-hosters chose to manifest experiences”). To answer that second question is pretty simple--return to the often-cited Harris poll from 2014 (co-sponsored by Eventbrite) that catapulted the notion of the experience economy into public consciousness.
The study found that “more than 3 in 4 millennials (78%) would choose to spend money on a desirable experience or event over buying something desirable.” It also claimed that since 1987, the share of consumer spending on live experiences and events relative to total U.S. spending increased 70%, and included this rather staggering-looking graph along with it.
That’s technically true, except when you zoom in on the Y-axis the total amount is really quite tiny: experiential spend went from 0.03% of total consumer spend to a little over 0.05%. Yes, that’s technically a 70% increase…but on a tiny base.
And then the real kicker is this little disclaimer at the bottom of the study. Basically, they surveyed a little over 2,000, just 507 of whom were millennials. And from that, an entire experiential economy was born.
Of course, you might now have other qualms about the study. Why, for example, would the question have been posited as an either/or? Most people like experiences AND things. And the fact that Eventbrite, whose entire business model is predicated on experience, sponsored the study seems to have been overlooked.
So back to the “40% of consumer spending” claim. From the original article on optimized-for-TikTok-brands, I landed on a Mckinsey publication, which linked to a 108-page report, titled The State of Fashion, 2019. The “40%” claim was on page 45 of the report, but not derived from any original research; instead I was sent to a footnote citing an Inc article urging me to “Forget Millennial Purchasing Power…” because “Gen Z Is Where It's At” (perhaps, unintentionally, undermining the momentum behind the millennial experiential economy?). Interestingly the piece doesn’t even cite the 40% claim -- it says the following:
This Barkley report estimates Gen Z's earnings to already be close to $153 billion, with overall spending of almost $100 billion. Once combined with allowance estimates (since many are in their young teen years), this yields $143 billion in Gen Z spending. And it doesn't even factor in the youngest Gen Xers who earn money by mowing lawns and babysitting. Considering that this Nielsen study shows Millennial spending at just over $65 billion, these numbers are staggering.
Before we get to the Barkley report, from which the 40% claim was spawned, it’s just kind of funny to pause and appreciate the attempt at skepticism -- a little missive to the future readers to take things with a grain of salt; the writer hints at a wariness (though doesn’t explicitly question) the idea that it’s a little ridiculous that Gen Z earnings are close to $153bn, while Millennial spending is less than 50% of that at $65bn. But nonetheless. Let’s move to the report.
When you download the PDF, you see a 13-page study on “The Power on Gen Z Influence.” The study, composed by self-professed “Gen Z evangelists” promises to “develop reliable estimates of Gen Z’s spending power” and launches into a three-pronged sum-of-the-parts examination.
Direct Spending
First up in the Barkley study is an aim to ascertain Direct Spending. The first sin of the study is one that I alluded to in my tweet about this journey: the data that they use was published in 2013, from a Mintel survey conducted in 2012 of allowances for kids and teens ages 6-17 (the survey itself is behind a $4,000 paywall, so it’s hard to interrogate the underlying biases of the original source!).
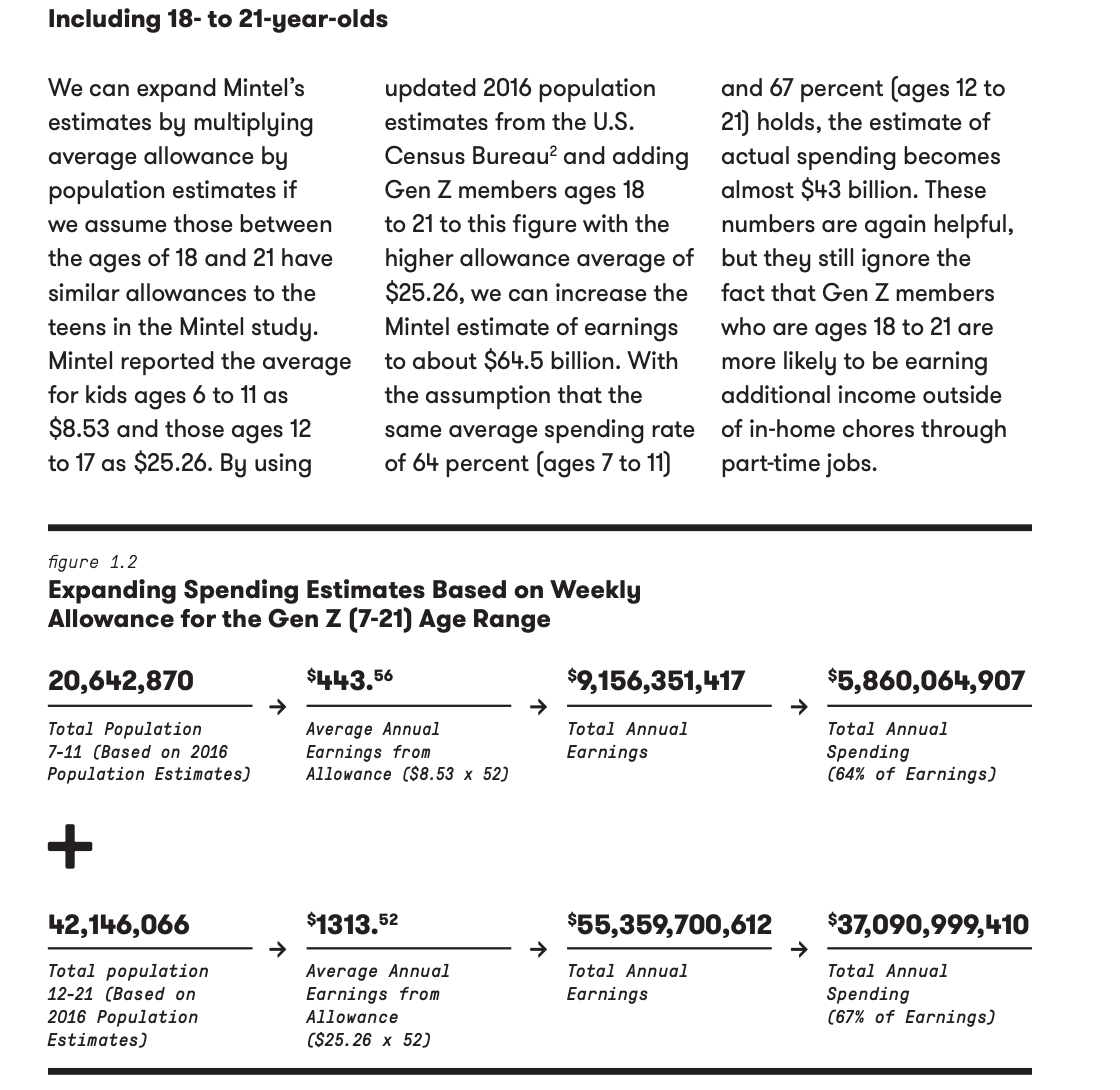
Still, they proceed with the numbers. By multiplying the 2012 population estimate of kids age 6-17 by the annual allowances for those children, adjusted for amount of allowance actually spent, the researchers arrive at $29bn in annual spending:
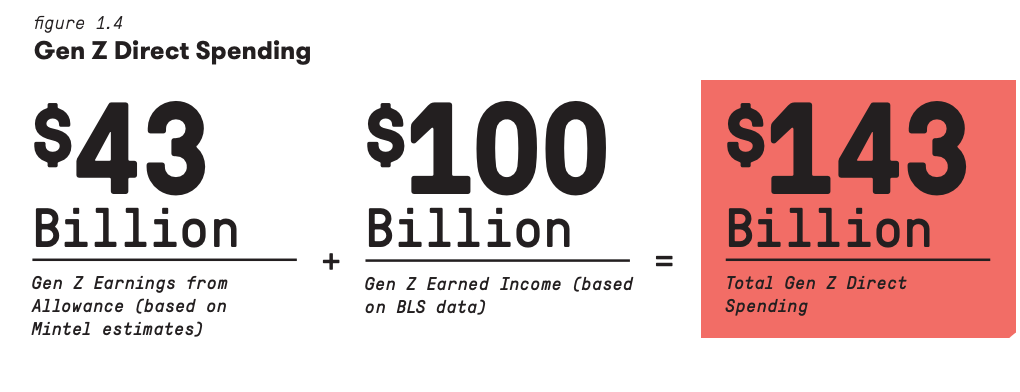
But they don’t actually do anything with this number. Instead, they use the weekly averages from the 2012 study on allowances, and extrapolate that out to a population sample of Gen Z-ers (using a population size from 2016).
So they arrived at $43 billion in estimated allowances. Before we move on, it’s worth stating all of the assumptions embedded in this process:
The weekly allowance is an accurate number
All kids get an allowance
The reported % of allowance spent is accurate (this, again, is a stat from the Mintel study conducted in 2012 and released in 2013)
But wait there’s more (there would have to be, if Gen Z were 40% of American consumers, who spend an aggregated $16 trillion or so per year…).
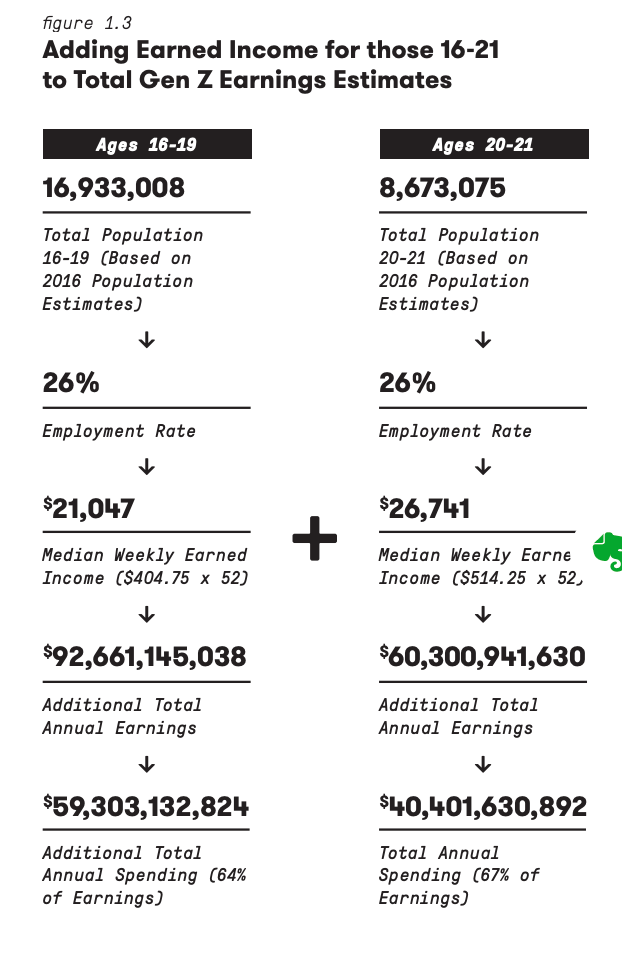
The next step is accounting for Gen Z’s earned income. To do this, they provide this chart.
These numbers are a bit more difficult to verify because the 2016 BLS segments their age-based employment in increments of 16-19 and 20-24 (to be honest, I’m not entirely sure where those population estimates came from; sure, the youth employment rate is around 26%, but no census I’ve seen has a precise population count for ages 20-21). But even if we accept that the population numbers are accurate, there are tons of other problems with the estimates:
They’re yet again using the Mintel data about percent spent on allowance, and applying those same percentages to PERCENT OF INCOME SPENT.
Oh, perhaps even more egregiously, they’re using pre-tax median weekly income (which the BLS reports)
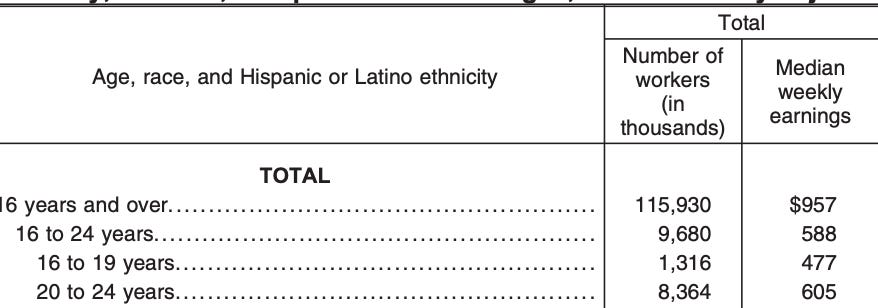
Ok so let’s fix this. Because working millennials are now age 16-23, you could use BLS data from the first quarter of 2020 (to account for COVID-induced job losses). That’s a larger population, so we might even find that the earned income, and therefore the spending of Gen Z is higher than what the Barkley study finds. Right? Not quite.
The BLS counts 1.3mm workers age 16-19 and 8.3mm workers age 20-24. Median weekly wages are $477 and $605.
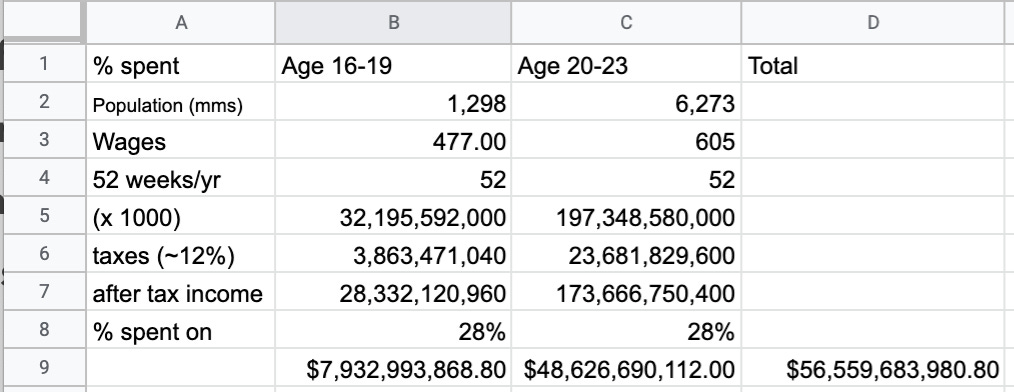
If we wanted to build a model to estimate Gen Z spending, it might look something like this. Here are my assumptions
a tax rate of ~12%
spending outlay at 28%. This is derived from the BLS’s very detailed breakdown of annual spending by category. I used % counts for personal care, entertainment, apparel, household furnishing, housekeeping, and food.
I adjusted the number of workers in the second column to exclude 24 year olds (by multiplying 8,364 by .75)
Again, you might dispute my assumptions; someone working a job at age 16 might have different outlays/imperatives than someone working at age 21. And anyone making near-minimum wage is probably spending most of their money on necessities — not optimizied-for-TikTok errata.
There is also the potential problem of over-counting. I doubt that the Gen Z-ers age 16-21 (or 23) are ALSO getting an allowance, so the first number posited by Barkley is probably suspect too. I’d subtract the people age 16-21 from the population count in Figure 1.2 a few paragraphs above (a correction of ~4.4mm people). This results in $33.1bn in total allowance spending for people age 12-21, not $37bn.
So instead of:
I get closer to $39bn in allowances (5.8bn for kids age 7-11 + 33.1bn for kids age 12-21) plus 56.5bn in spending, for a total of 95bn. Not 143bn.
Indirect Spending
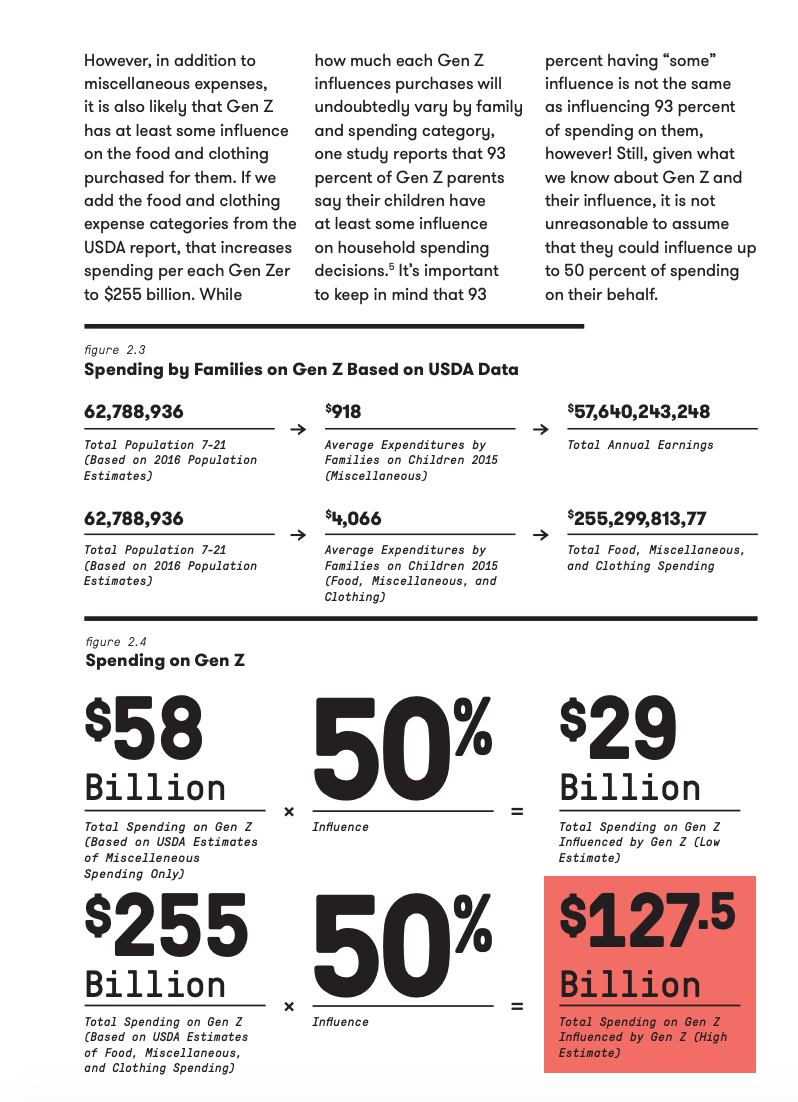
The next calculation might be the most reasonable of the bunch. The Barkley report now moves trying to ascertain the influence a child can exert on their parents’ spending habits. Here’s what they get:
To be honest, it does make sense that a child would exert influence over the products that their parents buy for them. But then, they had to go a step further:
The Barkley report posits:
In addition to indirect spending on Gen Z, there is the indirect household spending that Gen Z is able to influence. The parents of Gen Z have told us in multiple surveys by multiple organizations that their kids influence purchase decisions, but just how much money is at play? Once again, we used the Census Bureau’s 2016 population estimates to determine the size of Gen Z in the U.S. To determine total household spending, we looked at Consumer Expenditures for 2016 from the Bureau of Labor Statistics.
Wait but wasn’t this what they just calculated?
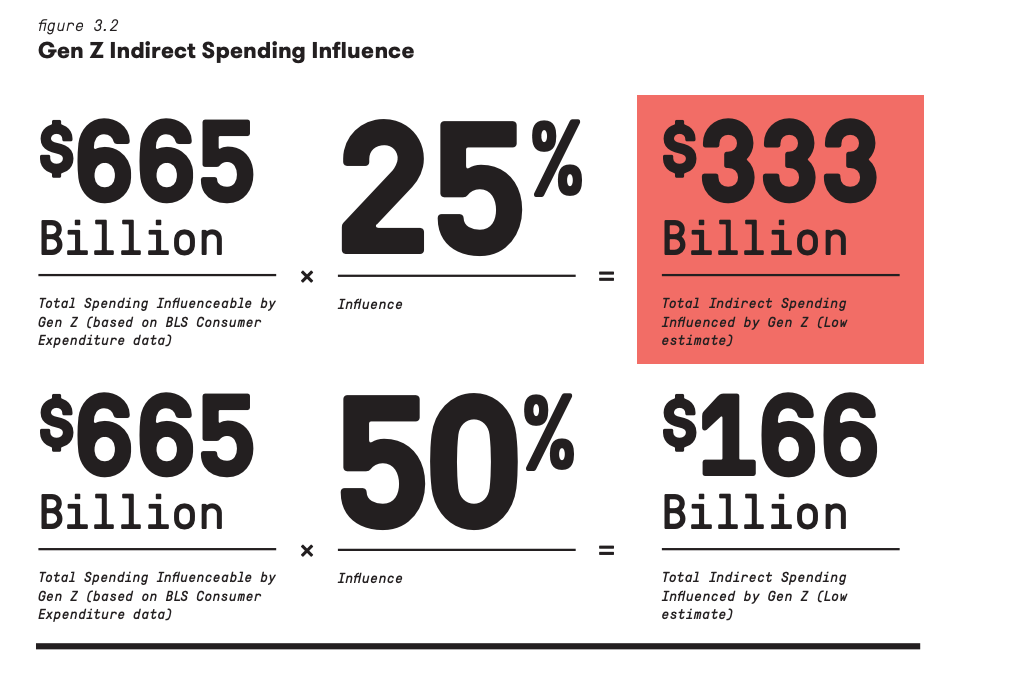
To estimate the potential household spending that Gen Z can influence, it’s necessary to make some assumptions. First, we must assume that Gen Z has influence predominately for expenditures in the food, apparel and services, and entertainment categories. Second, based on the estimated number of households with children ages 6 to 17 from the U.S. Census Bureau’s 2016 American Community Survey and our total population estimates of Gen Z from the Census Bureau, we assume each household has an average of just more than one (1.125) Gen Z child. This suggests that more than $665 billion in household spending in the categories of food, apparel and services, and entertainment can be influenced by Gen Z. Gen Z is unlikely to influence total spending in each of these categories, however, and it should also be noted that some of this spending will be on the household’s Gen Z member, meaning the sum in this case cannot be double counted. Still, if we assume that the Gen Z child influences just 25 percent of household spending indirectly, it means they can influence just over $166 billion dollars per year. If they have 50 percent influence, that number jumps to almost $333 billion.
So instead of just influencing spending on products for Gen Z, the kids can now influence spending that isn’t even related to them (their parent’s clothings, the films that their parents see, the food their parents eat, etc)? To support this dubious assumption, they include this chart.
Moving beyond the fact that there’s a typo in the above chart (the 50% and 25% should be flipped), what’s most baffling to me about this chart is that there’s no attempt to explain if or how it should relate to the numbers above. Which brings me to…
If you scrolled through the entire post, stop here, this is the good part
The craziest thing about the Barkley report is that it just kind of stops after the second assumption about indirect spending. There’s no culminating paragraph, no recap, no attempt to add together the numbers that we’ve just spent so much time meticulously calculating. Am I supposed to add up their claim about $143bn in direct spending, $29-127bn in indirect spending, and $166-333bn in indirect-er spending and arrive at some kind of clarifying total (indirect-er marketing seems to be the miasmic corollary of influencer marketing — an appropriate category to put this entire report into)? How am I supposed to use these numbers? Why are the ranges so wide, and why is there no attempt to resolve them?
Actually no, the craziest thing is what comes after the claim that Gen Z might influence up to $333bn in spending.
There is exactly zero needle-threading from the numbers in the report, to the conclusion that Gen Z will represent “40% of all consumers” Even if you were extremely generous, and added the highest of Barkley’s own estimates above (direct, indirect, indirect-er) you’d get to 603bn in spending. But annual consumer spending is closer to $14-15 trillion dollars — which is more like Gen Z accounting for 4% of consumer spending. Anyway…
How we got here
Let’s retrace the steps, in reverse now. What’s fascinating about the genealogy of the 40% claim is that it actually wasn’t even mentioned in the Inc article, which meant that someone at Mckinsey delved into the Barkley report, scrolled to the end, and unearthed the 40% figure without bothering to track the assumptions therein. And when that number got attached to McKinsey, it was able to circulate ridiculously far. There should be a word for this too — the kind of legitimacy-brokerage that a firm like Mckinsey confers, allowing ideas to get packaged, and distributed as if they’re pre-verified.
In some ways, this is deeply insignificant -- just one tuft of misinformation in a sea of mendacious folly. But also, kind of wild to think about the millions of marketing dollars wasted on this.
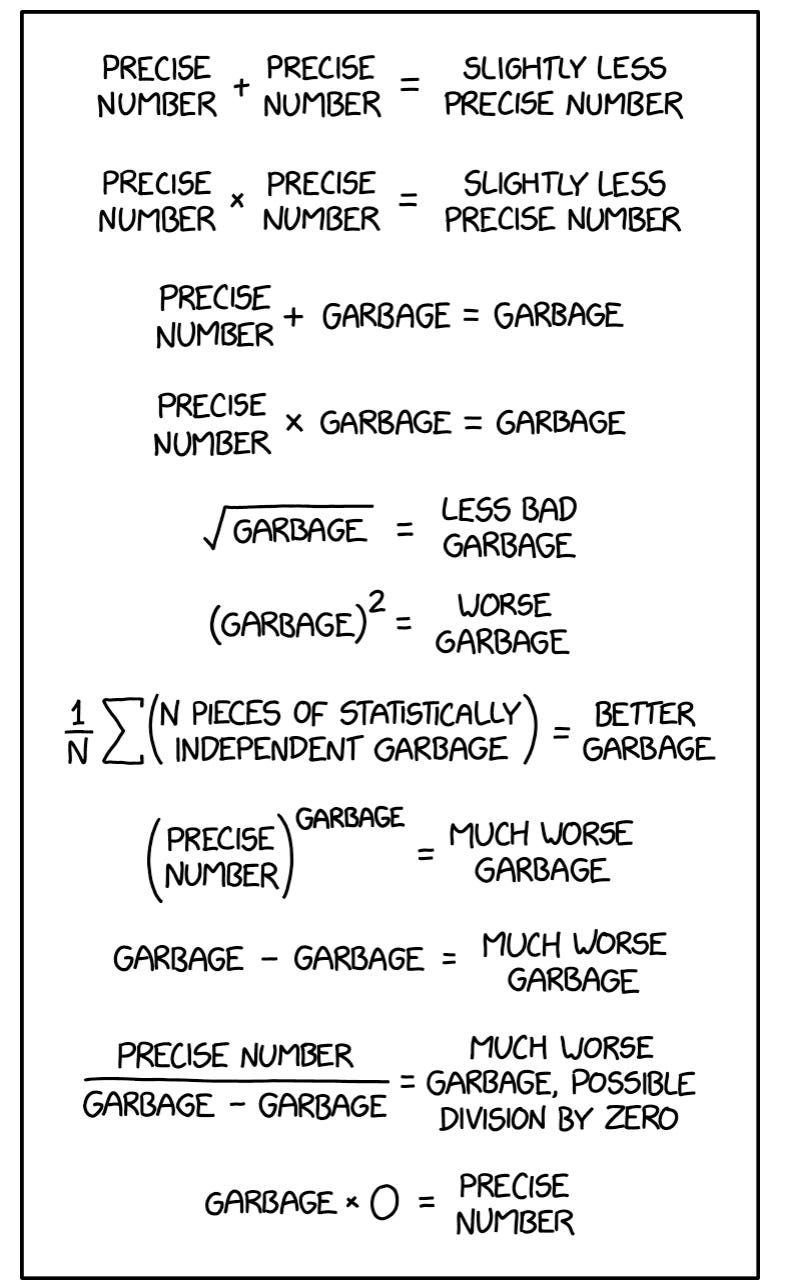
Anyway, all of this reminds me of this xkcd comic:
If you’d like to get in touch, my Twitter is @VirtualElena and my email is elena96b@gmail.com


